Speed
The Speed tab says how fast your site is for the people using it: not in a lab test, but in your real visitors' browsers, devices and connections. It sums up the project's Web Vitals and shows the slowest pages and requests.
The data comes from the browser SDK with speed measuring on. If nothing has arrived yet, the tab says No page views here yet and See how leads to the setup.
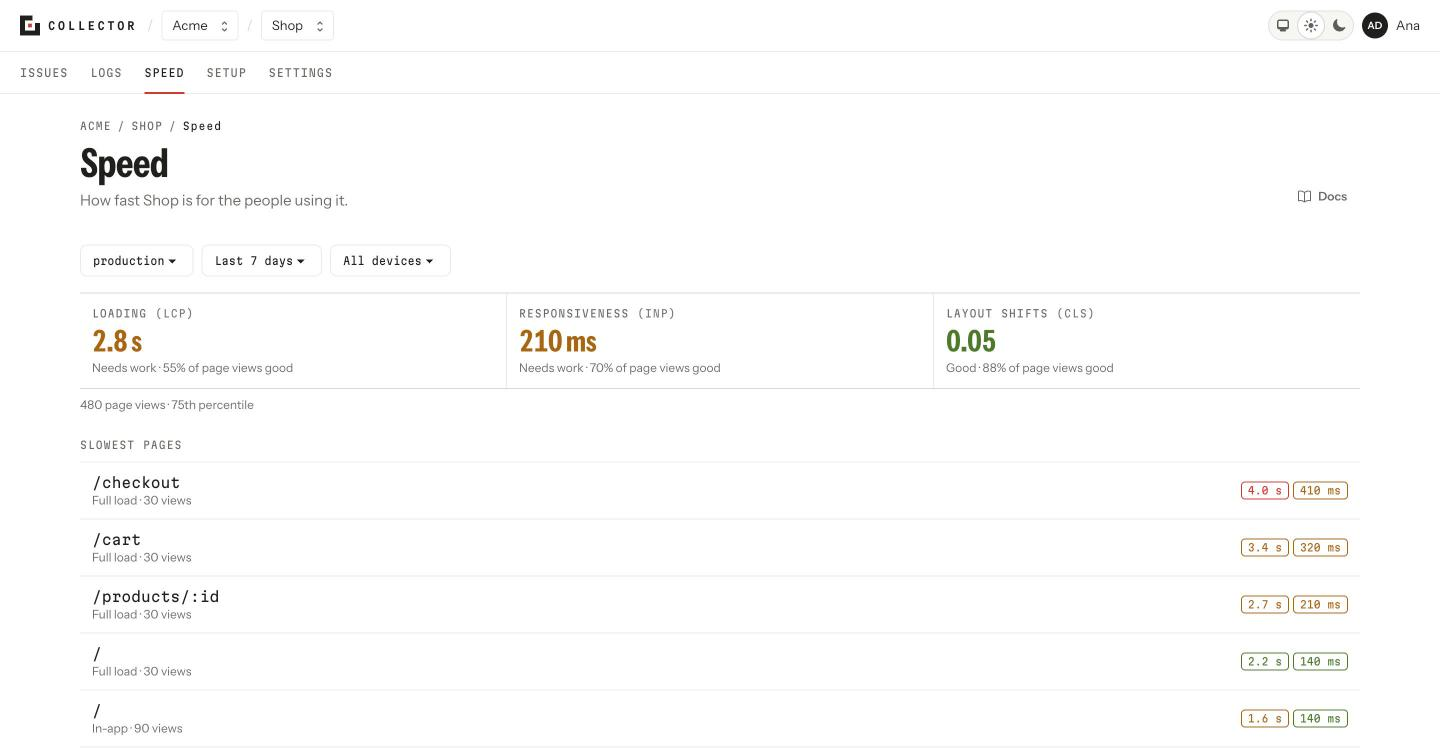
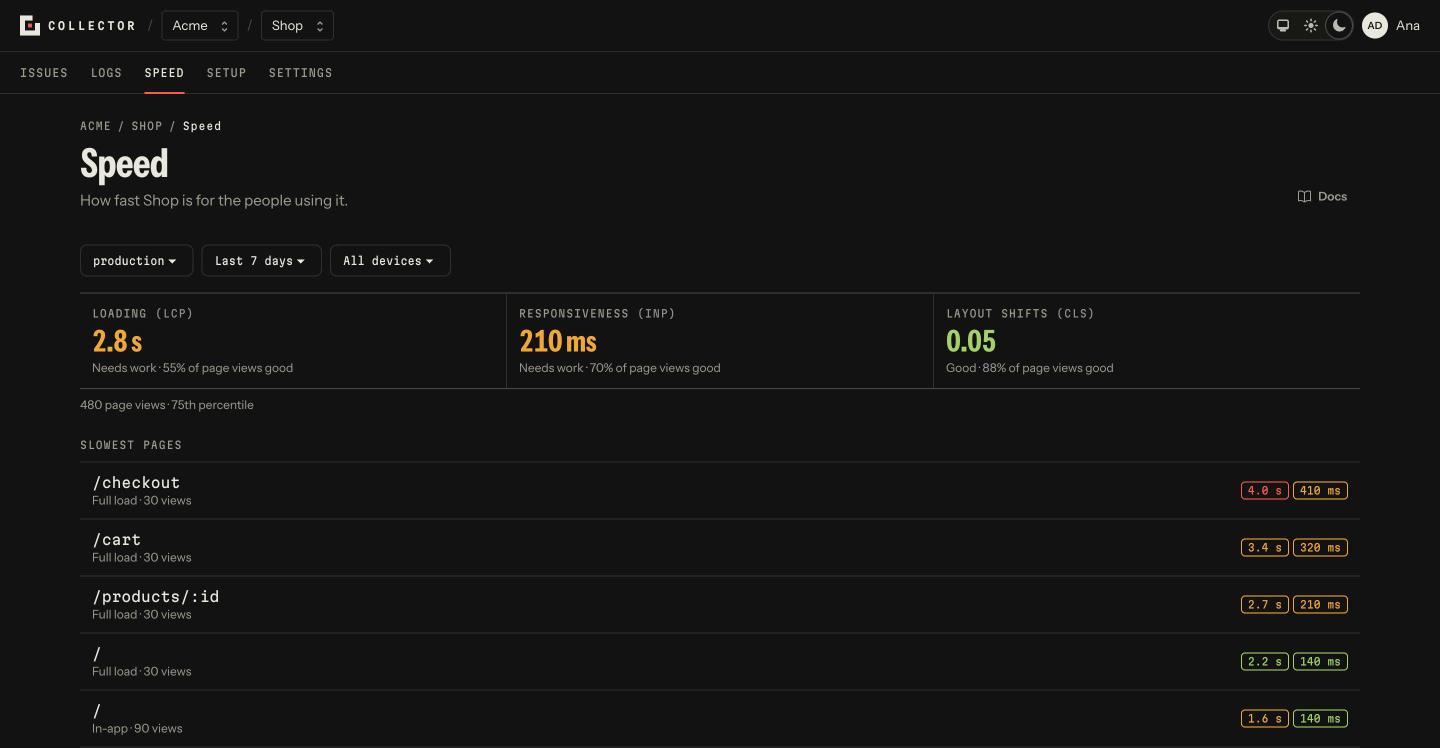
The filters
- Environment: one at a time.
- Time range: Last 24 hours, Last 7 days (the default), Last 30 days or Last 90 days.
- Device: All devices, Phones, Tablets or Desktops.
The filters live in the page's address and carry over to the detail pages.
The Web Vitals
Three numbers sum up the project, each at the 75th percentile: the value 75% of page views matched or beat. Each is rated Good, Needs work or Poor by Google's thresholds:
| Measure | What it measures | Good | Poor |
|---|---|---|---|
| Loading (LCP) | When the page's main content appeared. | up to 2.5 s | over 4 s |
| Responsiveness (INP) | How long the page took to react to clicks, taps and typing. | up to 200 ms | over 500 ms |
| Layout shifts (CLS) | How much the content jumped around while the page loaded. | up to 0.1 | over 0.25 |
Two more measures show on the detail pages:
| Measure | What it measures | Good | Poor |
|---|---|---|---|
| First byte (TTFB) | When the server's first answer arrived. | up to 800 ms | over 1.8 s |
| Navigation | For moves within the app: from the click until the page settled. Single-page apps have no LCP on those moves, so this is their measure. | up to 1 s | over 2.5 s |
With fewer than 20 page views, the numbers show but aren't rated: they're too few to judge.
Sampling
Speed measuring can be sampled: measuring only some of the tabs. When the project samples, the tab says so (10% sampled) and the counts it shows are estimates from that sample.
Slowest pages
The pages with the worst times, each with its kind of load (Full load or In-app), its main measure and its responsiveness. A page is a route pattern (/products/:id), not every address: if your application doesn't tell the SDK its route, Collector groups addresses by replacing segments that look like ids with :id. Pick one to see its detail; see Pages and requests.
Slowest requests
The fetch and XHR calls your pages make, grouped by method and route, with their 75th-percentile duration as the browser saw it. It answers the question "is it the backend?". Pick one to see its detail.
From the terminal
collector speed                        # Web Vitals and the slowest
collector speed pages
collector speed page /checkout
collector speed request POST /api/cart