Logs
The Logs tab puts what a project's servers send on a single timeline: their log lines, every HTTP request they serve and their sign-in attempts. The newest is on top, and times are in UTC. It's for following what happens now, for rebuilding what happened around an error, and for catching attacks: sign-in abuse, scanning, unusual volume.
For logs to arrive, your servers need a server key. How to turn them on in each language is in Elixir, Node and OpenTelemetry.
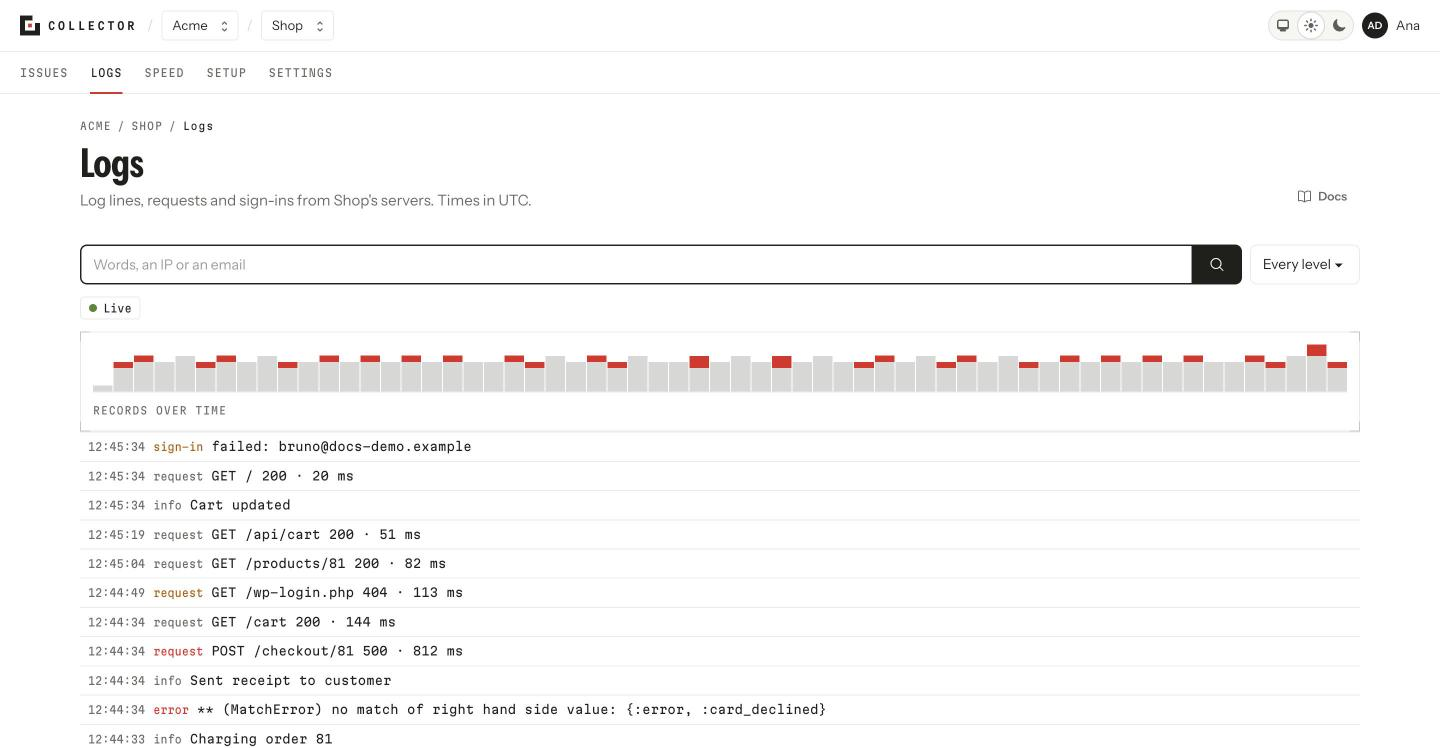
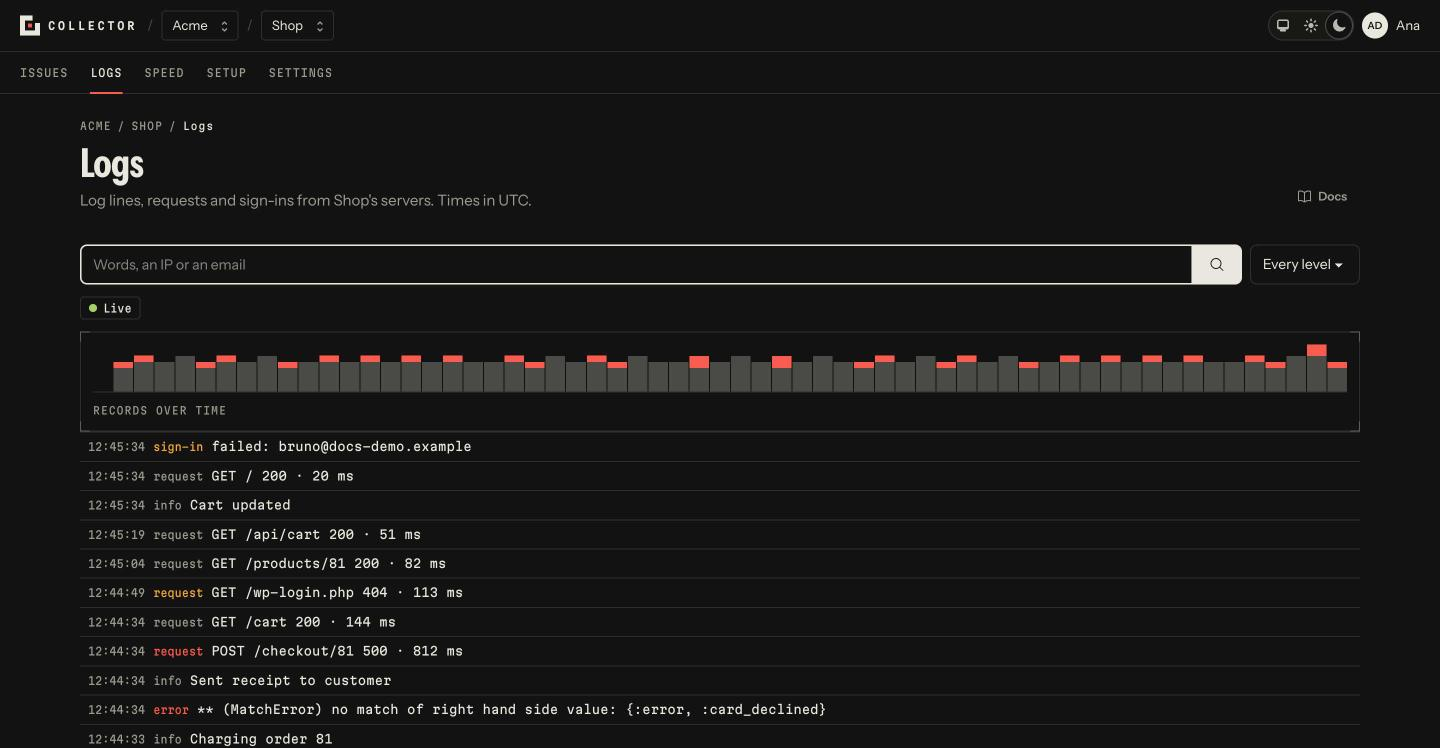
Live
With no moment picked, the tab is Live: records show up as servers send them. If you scroll down to read something older, or pick Older, the view holds still; Back to live brings it back to the present.
On top, a chart shows the Records over time. Each bar is a link to that stretch.
Three kinds of record
- Log lines, with their level (
debugtoemergency), their message, their logger (the module or logger that wrote it) and their metadata. - Requests, with method, path, route, status, duration, IP, user agent and response size.
- Sign-ins, with their outcome (
succeededorfailed), the account that was typed, the method, the reason for a failure and the IP.
A row sums up the record in one line; open it to see all its fields. Log lines written during a request carry its id, so you can see the whole request with everything it logged.
Searching and filtering
- Search (Words, an IP or an email) finds text in messages, in request paths and in sign-in accounts.
- Level shows Every level, or from one up: Warnings or worse, Errors or worse, … A request with a 5xx status counts as an error; a 4xx and a failed sign-in, as a warning.
- Any value of an open row can be used as a filter: the server, the environment, the IP, the user, the account, the request, the path, the status. Picking it adds it as a chip above the list; clicking the chip takes it away.
Filtering by IP, account, status or path brings the requests and sign-ins that have it, and also those requests' log lines.
The filters live in the page's address: a copied link opens the same view for anyone on the team. If nothing matches, Clear the filters starts over.
From an issue
On an issue's page, the Logs link opens this tab at the moment of the error, on its server, with its request marked and the nearest error flagged. It's the quickest way to see what was going on when something broke.
What's kept
Logs are kept as sent, for a year. Collector doesn't mask anything: what your application logs is its responsibility. See Security and privacy.
Every project has a budget per kind of record, so a flood of one doesn't drown the others. See Limits.
From the terminal
collector logs                                # the most recent
collector logs payment declined --level warning
collector logs --request F3xAbCdEfGh --markdown
collector logs --follow                       # live, in the terminal
See Commands.