An issue
An issue's page shows, top to bottom, what broke, how often, where in your code, what happened just before and in what context. It has no tabs: everything is on the same page. You open it from the Issues list or from the link in the email that told you.
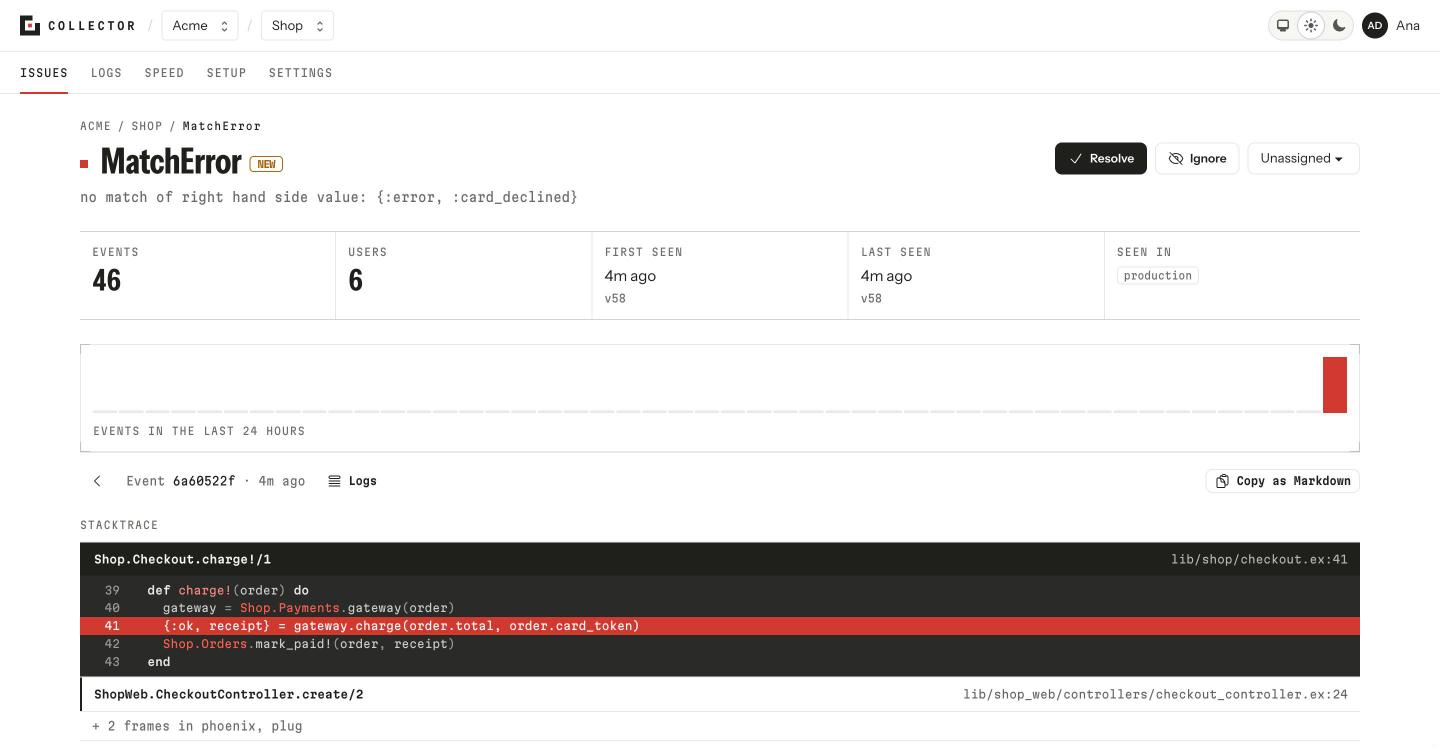
The header
The title is the error's type and message; under it goes the full message. On the right are the actions: Resolve, Ignore or, if the issue isn't unresolved, its status and Reopen. Next to them, Assignee: whose it is on the team, or Unassigned. See Issue statuses.
The issue's facts
- Events: how many times it happened, all time.
- Users: how many distinct users it affected.
- First seen: when the first event arrived.
- Last seen, or regressed, if it came back after being resolved: when, and in which release.
- Seen in: the environments it happened in.
Below, a chart with the Events in the last 24 hours.
One event
What follows describes one of the issue's events, starting with the latest. Older event and Newer event (or the ← and → keys) step through the others. Every event has its own address, so you can link to a particular one.
Next to the navigation, depending on what the event carries:
- Logs opens the logs of the moment it happened, on its server, with its request marked. It shows when the event carries the server's name or the request's id, and the project receives logs.
- See this visit opens the browser visit it happened in, if that tab was measuring speed.
- Copy as Markdown copies the issue and this event as text, ready to paste to an AI agent working on the fix: the error, where it happened, the stack trace with your code, what happened before and the context, in your language.
If the event arrived over the project's limit, the page says so: it was counted, but its details weren't kept. See Limits.
The stack trace
Stacktrace shows the error's frames, from the one that raised it outwards. Your own code's frames show in full; the first of them is already open, with the lines of code around the one that failed. Dependency and standard library frames are grouped and folded, so your code reads without noise; open them if you need them.
If the error came from a browser and the code was minified, without source maps the stack shows the built code, and the page says which release they're missing for. Once you upload them, that event and later ones show the code you wrote.
If the error was logged instead of raised, the logged line shows above the stack. And if the event brought no stack, the page says No stack trace came with this error.
What happened before
A timeline of what the SDK noted before the error: requests, navigation, clicks, console messages, logs, database queries. It ends at the error itself. Each SDK decides what it notes; see its page under SDKs.
Context
The request it happened in (method, URL, allowed headers), the user, the server, the environment, the release, the SDK and the tags your application added.
Event JSON
The event as it arrived, for when you need a field the page doesn't show. The format is in The event.
From the terminal
collector issues show 2C7ZffP787kc                       # a summary
collector issues show 2C7ZffP787kc --markdown > issue.md # the text for your agent
collector issues events 2C7ZffP787kc                     # its events, newest first
collector issues event 2C7ZffP787kc <uuid>               # one event in full
An issue can be named by its id or by its page's address.